FROM TREE TO CUP
UNDERSTANDING COFFEE’S CARBON FOOTPRINT

In today’s sustainability-driven world, the environmental footprint of a simple cup of coffee is drawing increasing attention -not only from consumers, but across the entire value chain, from growers and importers to roasters and retailers.

Understanding where emissions occur along the value chain is essential to meeting evolving expectations -whether driven by regulation, market dynamics, or a company’ s own sustainability ambitions.

This insight explores the concept of a carbon footprint within the coffee industry, pinpoints the stages that contribute most to greenhouse gas emissions, and outlines how a better understanding of emissions can support more informed decisions and collective action across the coffee value chain.

Understanding Coffee’s Carbon Footprint – A Clearer Perspective 

What Does ‘Carbon Footprint’ Mean?

A carbon footprint refers to the total amount of greenhouse gases (GHGs) released into the atmosphere as a result of a particular activity. These gases include carbon dioxide (CO₂), methane (CH₄), and nitrous oxide (N₂O).

To fully account for coffee’s climate impact, we need to consider emissions at every stage:

  • Growing and processing the coffee at origin
  • Transporting and roasting the beans
  • Packaging & distribution to consumer
  • Brewing, consuming and managing waste (disposal or recycling)

Each stage produces different amounts and types of greenhouse gases. To compare their effects, emissions are expressed as carbon dioxide equivalents (CO₂e), which standardise gases based on their global warming potential. For example, nitrous oxide (N₂O) is nearly 300 times more warming than CO₂.

Measuring Emissions – Life Cycle and Emissions Scopes Explained

Calculating a carbon footprint is just one element of a broader analysis called Life Cycle Assessment (LCA) -a method used to evaluate the full environmental impact of a product or process from cradle to grave. In the case of coffee, this means assessing everything from planting the tree to brewing the coffee and disposing of the cup.

An LCA goes beyond measuring greenhouse gas (GHG) emissions. It also examines impacts on water use, soil health, biodiversity, and human well-being. In some cases, LCAs even address social factors.

To better understand where emissions fall within an organisation’s responsibility or influence, emissions are classified into three categories, known as emission scopes:

  • Scope 1: Direct emissions from a company’s own operations, such as fuel used in company vehicles or on-site heating.
  • Scope 2: Indirect emissions from purchased energy, such as the electricity used in offices, warehouses, or roasteries.

  • Scope 3: All other indirect emissions that occur across the value chain, from sources a company doesn’t own or directly control. For most coffee businesses, Scope 3 accounts for the largest share of total emissions -but it’s also the most complex to track and manage.

Measuring What Matters : The Challenges of Carbon Footprinting in Coffee

While identifying where greenhouse gas (GHG) emissions occur in the coffee value chain is relatively well understood, accurately measuring these emissions  -especially at the farm level, remains a critical and complex challenge. Several persistent barriers hinder the ability to generate consistent and comparable carbon footprint data across the sector.

THE MAIN KEY CHALLENGES 

Lack of rigorous farm-level data at scale:
Reliable data from the production and processing stages remains limited. Existing information is often sparse, fragmented, and collected using inconsistent methods or over varied timeframes. Collecting robust primary data takes time and financial resources -a significant hurdle in a sector where 90% of production comes from smallholder farmers, making data collection more difficult and sometimes less precise.
Moreover, current datasets frequently fail to capture the diversity of farming systems, practices, and their respective productivity across different regions. This lack of granular, farm-level data is a major obstacle to accurately estimating Scope 3 emissions, which represent the largest share of total emissions in the coffee supply chain.

Lack of harmonised methodologies:
There is no universally agreed methodology for calculating farm-level carbon footprints in coffee. Different studies apply varied approaches to critical elements such as land use change, soil organic carbon, emissions boundaries, and data allocation. These methodological differences result in inconsistent findings that are hard to compare across regions or supply chains.

Resulting Variation in Carbon Footprint Estimates
These two core challenges contribute directly to the wide range of carbon footprint values reported* in recent studies:
  • CIRAD’s meta-analysis found a footprint ranging from 0.15 to 14.5 kg CO₂e per kg of green coffee at the primary processing gate, with a median of 3.6 kg CO₂e. When including the full consumption phase (coffee as a beverage), estimates ranged from 2 to 23 kg CO₂e per kg of consumed coffee, with a median of 8.8 kg CO₂e.

  • A USAID and IDH carbon footprint study on Robusta production in Vietnam estimated emissions of 1.22 kg CO₂e per kg of green coffee from cradle to farm gate.

  • Nespresso reported an average of 3.9 kg CO₂e per kg of green coffee across 11 origins in its AAA Program, notably lower than the often-cited industry average of about 7 kg CO₂e per kg.


Additional Factors contributing to the challenges

Significant differences in farming systems, regional conditions, coffee varieties, input levels (e.g. fertilisers), and infrastructure further contribute to this variability -factors that are often underreported due to the same data gaps and inconsistencies.


COLLABORATIVE SOLUTIONS UNDERWAY

Because of these challenges, accessing consistent and comparable carbon data remains difficult, making sector-wide collaboration essential.

EFICO is actively engaging in efforts to improve carbon footprinting practices across the coffee sector:

Sustainable Coffee Community (SCC) – Latin America Baseline Study
EFICO is following this initiative, led by the Sustainable Coffee Challenge, which is collecting primary data across seven Latin American countries. The aim is to deliver a shared, science-based methodology for calculating coffee’s carbon footprint, expected by the end of 2025.

Complementary work in Asia
This builds on work by USAID Green Invest Asia, which established robust carbon baselines for Robusta production in Vietnam and Indonesia with broad industry backing.

Sustainable Coffee Community (SCC) Methodology Guide (expected fall 2025)
In parallel, SCC is developing a sector-wide guide to align key principles and methods for carbon footprinting in coffee -providing a foundation for replication and scaling climate action.

European Coffee Federation (ECF) – Product Environmental Footprint (PEF):
The ECF is working on a sector-specific PEF framework in line with LCA guidelines for substantiated environmental claims, as part of the upcoming EU Green Claims Directive.

At EFICO, our sustainability team is closely monitoring these developments. We remain committed to staying at the forefront of efforts to improve the measurement of carbon footprints across the coffee sector.

The Coffee Carbon Foodprint : Where are the Hotspots?

Despite wide variations in reported values*, most studies on the coffee value chain’s carbon footprint agree that the majority of GHG emissions occur at origin -during coffee production and processing, before the coffee has even left the farm. The next largest share of emissions arises during the use/consumption phase, including brewing, packaging, and disposal.

Recognising these key stages allows sustainability efforts to be focused where they can have the greatest impact.

MAIN EMISSION SOURCES AT THE FARM: PRODUCTION & PROCESSING

Land Use Change and Deforestation

Clearing forests to establish coffee plantations releases significant carbon stored in trees, making it the largest source of emissions at the production stage -up to 75%. Accurate measurement is challenging due to complex modelling and the need for long-term land use data.

To address this, the EU’s Deforestation Regulation (EUDR) sets new rules to prevent deforestation-linked coffee from entering the market. EFICO is proactively preparing for compliance by enhancing traceability and due diligence across its supply chain. Supported by tools like satellite monitoring, these efforts aim to improve transparency and reduce emissions from land use change over time.

Fertiliser Practices and Soil Emissions

Nitrogen-based fertilisers are commonly applied in large amounts by coffee farmers to boost yields. However, plants can only absorb a portion of this nitrogen; the surplus left in the soil is naturally converted into nitrous oxide (N₂O), a greenhouse gas nearly 300 times more potent than CO₂. Beyond these emissions, the production and transport of fertilisers to the farm add significantly to the overall environmental footprint

While many studies indicate that organic fertilisers generally emit fewer greenhouse gases, they do not eliminate emissions entirely. The type and amount of GHG released depend on the kind of organic material used and how it decomposes. Conditions matter: for example, coffee residues left in heaps decompose under low-oxygen conditions, potentially emitting up to 33 times more CO₂ equivalent than when used as mulch in the field, where decomposition is slower and more controlled.

The type of production system strongly influences fertiliser use and emissions. A Robusta study in Vietnam shows that monoculture farms have a significantly higher carbon footprint than diversified systems — primarily due to increased fertiliser application, reduced soil carbon storage capacity, and, on top of that, much lower biodiversity.

In addition to contributing to global warming, the use of synthetic nitrogen fertilisers also harms terrestrial and marine ecosystems. Excess N₂O can acidify soils and run off into surface water, eventually reaching coastal areas where it causes eutrophication -an overgrowth of algae that depletes oxygen and damages marine life.

Washed Coffee Processing and Water Use

Washed processing is the most common method used for Arabica coffee -valued for its ability to deliver consistent cup quality and enhance flavour clarity. However, it has a considerably higher environmental impact compared to the sun dry processing. This is mainly due to the large volumes of water required for washing and fermentation, and the resulting wastewater, which -if left untreated, can release methane (CH₄) and ammonia (NH₄) -both potent greenhouse gases. Methane, for instance, is 28 times more powerful than CO₂. To get back to acceptable levels of water pollution, even higher amounts of water are needed for dilution.

To address these impacts, more environmentally-friendly practices are being introduced in the field. These include systems that reuse wastewater -which may use up to 4 time less water than the traditional full washing process, or the installation of on-site biodigesters -which treat wastewater and generate biogas as a renewable energy source. However, such solutions require financial investment, technical knowledge, and available land.

While washed processing is water-intensive, irrigation -especially less efficient methods like flood irrigation compared to drip systems, can use 3 to 50 times more water, often accounting for a larger share of total water use in coffee production.

MAIN EMISSION SOURCES AT THE CONSUMPTION STAGE: BREWING & DISPOSAL

Brewing and Energy Use
Brewing is a major contributor to emissions during coffee consumption, especially when using capsule systems or inefficient machines with high electricity demand. Nespresso’s 2023 Life Cycle Assessment (LCA) confirms that energy use during brewing is a primary driver of emissions for a lungo cup made with an Original capsule.

Cup Washing and Water Heating
Washing coffee cups -particularly the energy required to heat water, adds a notable amount to the total carbon footprint. These routine, often overlooked actions can be nearly as impactful as the brewing itself

Packaging and Waste Management
Single-use packaging, especially pods and capsules, increases environmental impact. The carbon footprint depends heavily on the materials used and their end-of-life treatment (e.g. recycling, composting, or landfilling). Inefficient disposal and inadequate recycling infrastructure can significantly elevate emissions. Nespresso’s LCA also highlights the added impact from cup production, washing, and disposal, even though these stages are often beyond the direct control of coffee brands.

Source: Quantis LCA (2023) – interpretation* in notes at the end

CONSUMER CHOICES MATTER S

Ultimately, the end consumer’s decisions -such as the choice of brewing method, equipment efficiency, and waste disposal -play a crucial role in reducing the overall carbon footprint.

From Footprinting to Carbon Impact: Measure, Avoid, Reduce, Inset, Offset

Putting exact numbers on emissions is complex, but the ultimate goal isn’t precision -it’s generating meaningful, actionable data. Measurement is the foundation for any credible CO₂ strategy, helping to quantify emissions across all scopes and identify hotspots. This essential first step enables companies like EFICO to understand where emissions occur and how best to address them.

CO₂ action follows a clear hierarchy: first, avoidance prevents emissions from happening in the first place; next, reduction minimises emissions that cannot be avoided; and finally, for emissions that remain unavoidable, companies take responsibility through carbon insetting –supporting climate-positive projects within their own supply chains, and as a last resort, offsetting via verified external projects that reduce emissions elsewhere.

At EFICO, this approach guides our climate strategy. We begin by measuring emissions to identify impact areas, then focus on avoiding and reducing emissions wherever possible. Our Forest Positive project in Nicaragua exemplifies carbon insetting, supporting reforestation and regenerative agriculture at origin. A structured approach like this -measure, avoid, reduce, inset, offset, and transparently report -helps build resilient climate strategies, prepare for emerging regulations, and meet rising stakeholder expectations.

Harvesting Coffee and Carbon

Consistency and comparability in carbon reporting also depend on collective effort. That’s why EFICO supports sector-wide initiatives such as the Sustainable Coffee Challenge, which is conducting a baseline footprint study across seven Latin American countries and developing a harmonised methodology guide due later this year.

Even though carbon reporting is not yet mandatory under the CSRD Omnibus Proposal, EFICO chooses to act now -because real impact begins with measurement, and responsible stewardship means acting early and transparently.

NOTES, CREDITS, REFERENCES

*interpretation graphics Quantis LCA (2023)
European market adaptation Life Cycle Asessment (LCA) of a lungo cup of coffee made from a Nespresso original capsule compared with other coffee systems in Europe

Carbon Footprint of the Nespresso Original System

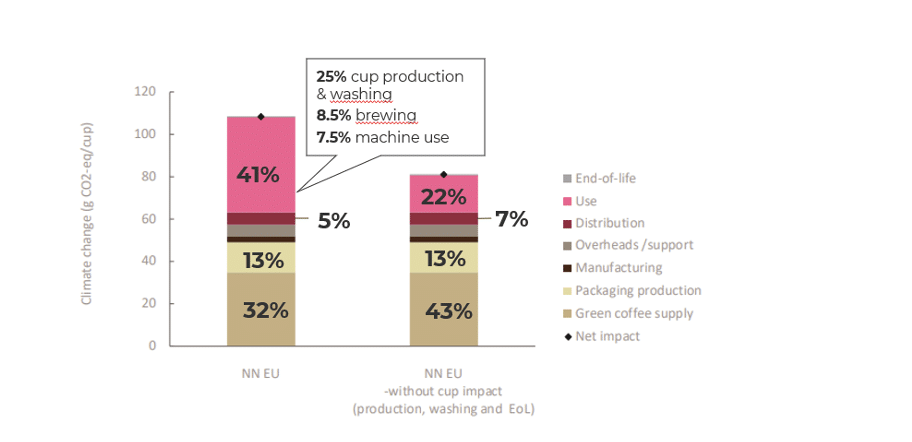
A 110 ml cup of Nespresso coffee emits approximately 108 g CO₂-equivalent on the European market. The largest contributors to this carbon footprint are:

  • Use phase (41%), primarily driven by:

    • Cup production and washing: 25%

    • Coffee brewing: 8.5%

    • Machine manufacturing, distribution, and cleaning: 7.5%

  • Green coffee supply: 32%

  • Packaging: 13%, broken down into:

    • Primary (capsule) packaging: 10%

    • Secondary packaging (sleeves and cartons): 3%

  • Distribution: 5%

  • Overheads and support services: 5%

  • Manufacturing: 3%

  • End-of-life (recycling, incineration, or landfill of packaging and capsules): ~0% (neither significant impact nor benefit)

The cup-related impacts (production, washing, and end-of-life) -though beyond the control of the coffee provider and consistent across systems, are included in the total lifecycle as they are essential for consumption. These contribute 27 g CO₂-eq, or 25% of the total footprint.

To simplify the product’s impact for consumers, Nespresso also provides a view excluding the cup impacts. In this adjusted scenario, the contributions shift as follows:

  • Green coffee: 43%

  • Machine use: 22%

  • Capsule production: 13%

  • Distribution: 7%

  • Overheads: 7%

  • Other packaging: 3%

  • Manufacturing: 3%

  • End-of-life: 0.3%

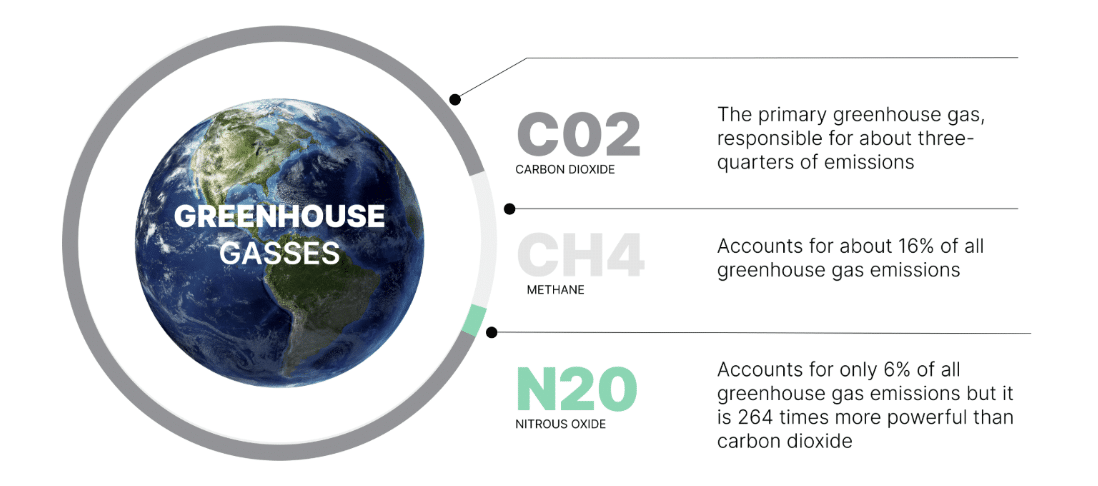
Carbon Footprint: The carbon footprint is a measure of the potential impact on climate change. It takes into account the capacity of a greenhouse gas to influence radiative forces, expressed in terms of a reference substance and specified time horizon (100 years). The impact metric is expressed in kg CO2-eq.

End of life: The end-of-life stage includes the collection and treatment of the different packaging items, the coffee grounds, the machine and the cup.

LCA: Life Cycle Assessment

EFICO – Harvesting Coffee and Carbon
EFICO – EFICO plants trees with impact in Tanzania
CUPRIMA – Recents Developments in coffee processing – unlocking flavours
EFICO FOUNDATION – Kilimanjaro Water and Food for All – Project
EFICO FOUNDATION 20Y Flagship Project ‘Kilimanjaro Water & Food for All’
EFICO – Nicaragua SHG Rainforest Alliance Forest Positive Coffee
EFICO – Insights and Takeaways from Efico’s Sustainability Team for EUDR Compliance
EFICO – Communication of Progress Y 2024
CDP – Brewing a Sustainable Future: the Carbon Footprint of your Coffee
ScienceDirect – Comparing carbon agronomic footprint and sequestration in Central American coffee agroforestry systems and assessing trade-offs with economic returns
Barista Hustle – The Decision Tree – The Carbon Footprint of Coffee Cultivation
Espresso Outlet – Eco-friendly Wastewater Treatment Solutions for Coffee Processing Facilities
CIRAD Agricultural Research for Development – Review on  Green Coffee Carbon Footprint
USAID – Scaling up Sustainable Robusta Coffee Production in Vietnam – Reducing carbon footprints while improving farm profitability
Nespresso – The Positive Cup – 2022 Progress Report

Share This Story, Choose Your Platform!